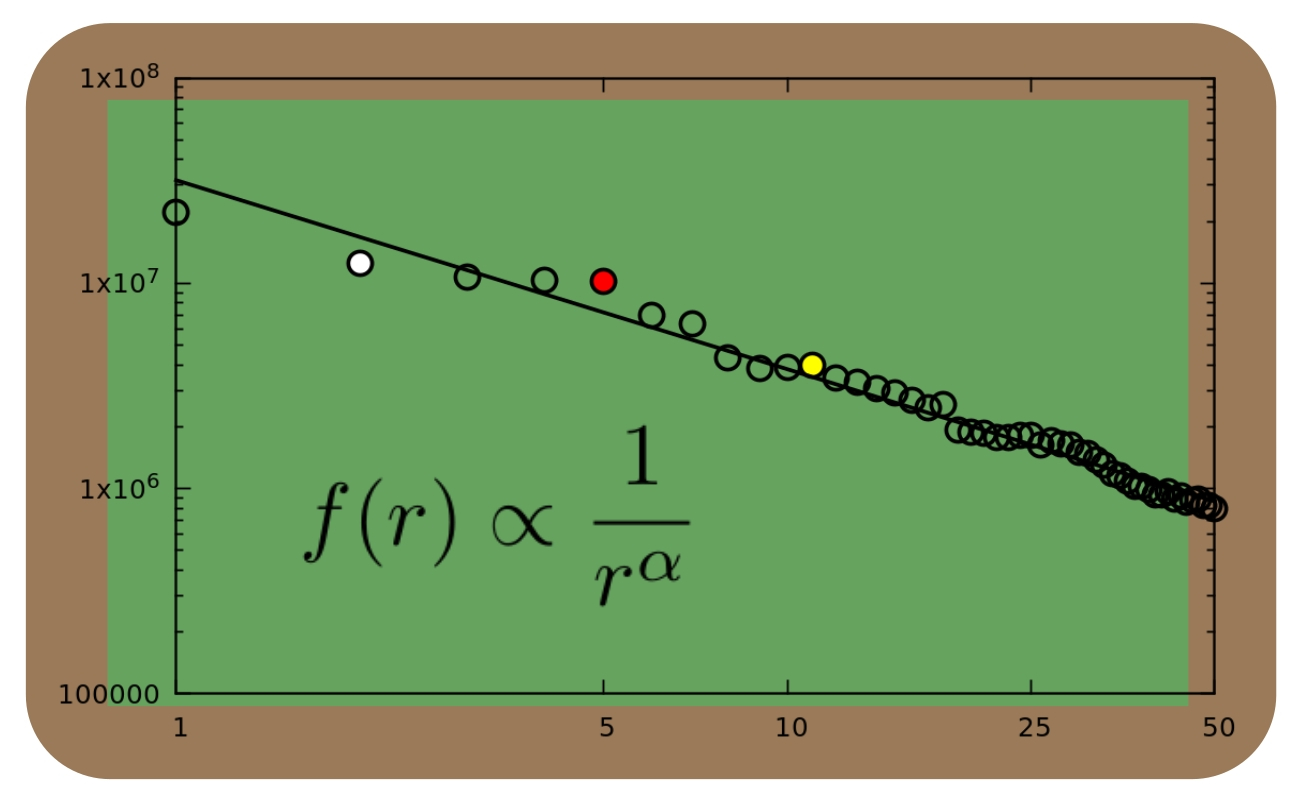
Snooker rankings appear to follow a statistical pattern similar to that observed in word frequencies in language. This pattern is known as Zipf’s law, or more generally as a power law. Such mathematical patterns have been observed in other sports rankings as well, but snooker statistics had not yet been analyzed in as much detail. Until recently.
Power laws
Zipf’s law is well known in linguistics. When you rank words according to their frequency of use, from highest to lowest, the frequency of the word at rank two is roughly half of the frequency of the most frequent word (at rank one). Similarly, the frequency of the word at rank three is roughly one third of that of the most frequent word, of rank four roughly one fourth, and so on. In other words, the frequency of a word is inversely proportional to its rank.
The American linguist George Zipf was the first person to write about this phenomenon in a book he published in 1935.[1] This kind of rank-proportional behavior in language is an example of a mathematical power law. In mathematics, a power function is simply a repeated multiplication. For example, 4 raised to the power 3, written as 43, is 4×4×4 = 64. Similarly, 2 raised to the power 5, or 25, is 2×2×2×2×2 = 32.
With a power law, the frequency with which something occurs is inversely proportional to its rank r raised to a certain power a, or ra, where a is called the exponent. For example, if a=4 then the frequency would be inversely proportional to r4 = r×r×r×r. For word frequencies, as Zipf observed, the value of a is close to one (r1 = r). But the value of the exponent a does not need to be a whole number. Although it is difficult to do the calculation in your head, something like r0.5 (a=0.5) or r2.3 (a=2.3) is mathematically perfectly well defined.

Such power laws are not restricted to languages, though. They also show up in other types of statistics, such as earthquake magnitudes, city sizes, website hits, academic citations, intensity of solar flares, wealth distributions, etc.[2] It is not surprising, then, that they also show up in sports rankings.[3]
Indeed, power laws (or variants thereof) have been shown to appear in the rankings of sports and games such as football, tennis, golf, baseball, badminton, chess, poker, and several others.[4] However, snooker rankings had not been analyzed in as much detail yet, until recently. Below is an easy-to-follow summary of a detailed analysis of snooker statistics in terms of power laws.[5] But first, let’s see how power laws can be mathematically detected in ranking statistics.
Finding power laws
Power laws can be recognized visually by plotting the relevant data in a graph, or chart, with the ranks on the horizontal axis and the corresponding frequencies on the vertical axis. One characteristic feature of a power law is that it shows up as a straight line in a so-called log-log plot. In such a plot, both axes are on a logarithmic scale instead of a linear scale.
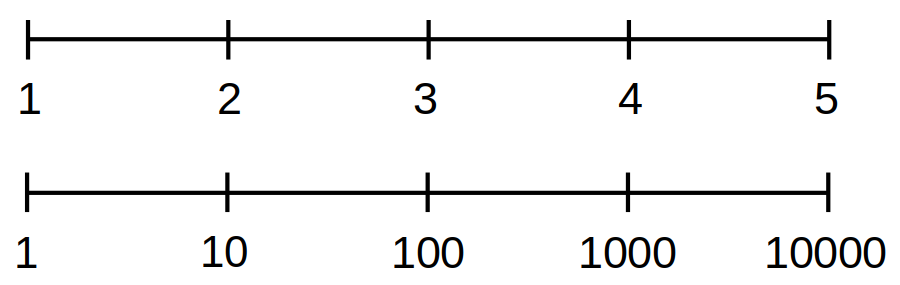
With a linear scale, the values at regularly spaced intervals increase by a fixed amount. For example, we could have the sequence of values 1, 2, 3, 4, 5, and so on, at regular intervals along an axis. Each next value is simply increased by one compared to the previous value. Or we could have the sequence 0, 10, 20, 30, 40, and so on, where the fixed increase is 10.
With a logarithmic scale, on the other hand, each next value is the previous value multiplied by a fixed amount. For example, we could have the sequence of values 1, 2, 4, 8, 16, 32, and so on, at regular intervals along an axis. Each next value is twice as large as the previous one. Or we could have 1, 10, 100, 1000, 10000, and so on, where each next value is the previous value multiplied by 10.
As an example of ranking statistics in a log-log plot, let’s consider Zipf’s original observation in linguistics. The graph below shows the frequencies (along the vertical axis) of the 50 most frequent words in the English language plotted against their rank (along the horizontal axis), with both axes on a logarithmic scale. The frequencies were measured over a very large collection of English texts with a total of over one billion words.
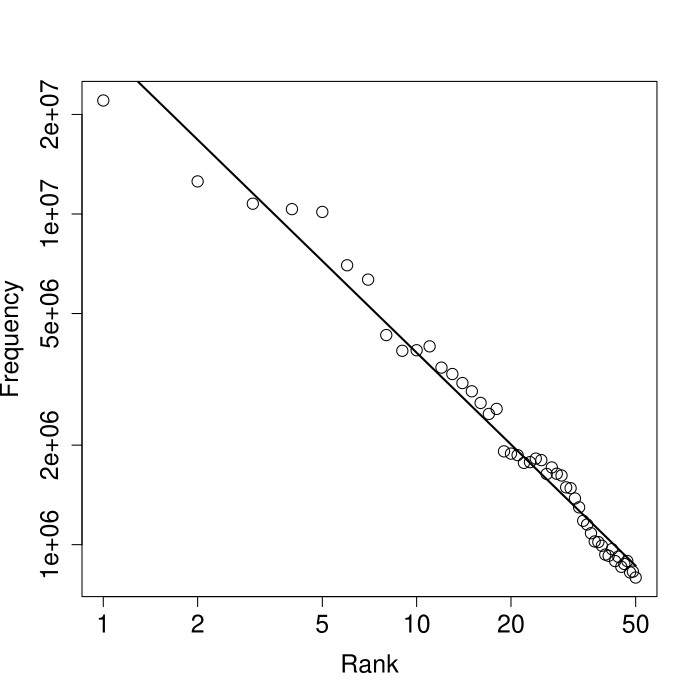
The open circle at the top-left represents the most frequent word (which is “the”) with rank r=1 and a frequency of about 20 million. The value “2e+07” at the top of the vertical axis is scientific notation for a 2 followed by 7 zeros, or 20 million. Similarly, each open circle represents one of the 50 most frequent words, indicating their rank and frequency.
The straight line in the graph represents a power law that has been fit to the data using a mathematical estimation method. As you can clearly see, the data does not follow a straight line exactly. Sometimes the data points (open circles) are somewhat below the line, and sometimes somewhat above. If we add up all of these small differences between the open circles and the straight line, we get a total amount of error.
If the straight line was drawn a little steeper, or a little shallower, or moved over a little bit to the left or right, this total error would change slightly as well, becoming either smaller or larger. The straight line as shown in the graph, and as determined by the mathematical estimation method, is the one that minimizes the total error, i.e., it minimizes the difference between the actual data (open circles) and a perfect mathematical power law (straight line).
In other words, the straight line in the graph represents the best possible fit of a power law to the data. This best fit results in a particular value of the exponent a in the estimated power law. For the word frequencies, this value is a=0.92, which is indeed close to one, as Zipf had already found a long time ago.
Finally, the mathematical estimation method also provides a goodness-of-fit value, i.e., a measure of how accurately the best fit matches the actual data. For the word frequencies example above, this goodness-of-fit value is 98%, which is very accurate indeed.
Power laws in snooker rankings
Now let’s have a look at some actual snooker statistics. There are several types of rankings one can consider in snooker, such as total prize money earned, number of centuries scored, or any other criterion. Also, different time frames can be considered, such as an all-time ranking, or a one year ranking. In the detailed study referred to above, different types of rankings and time frames were considered and compared. Here, just one of those results will be shown. All the data analyzed in the detailed study were obtained from CueTracker.
The graph below shows the top 50 of the all-time prize money ranking, with both axes on a logarithmic scale. The straight line again represents the best fit of a power law to this data. Although the goodness-of-fit is slightly lower than that for the word frequencies, at 95% it is still quite accurate. The resulting value of the power law exponent is a=0.71.
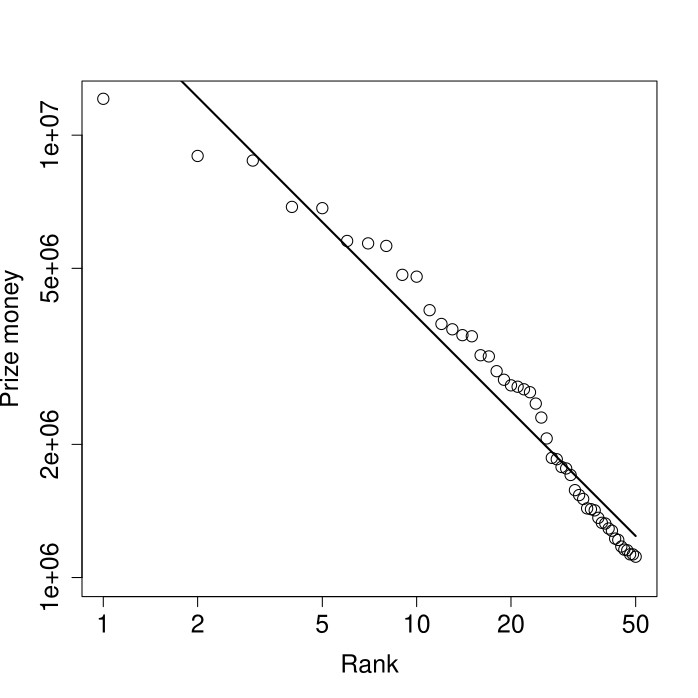
As the graph shows, the slightly larger deviation from a straight line (compared to the word frequencies) is mostly at the very top of the ranking, especially at ranks one and two (the leftmost two open circles). This is actually quite common in sports rankings that are still “in the making”. But other than that, the graphs for the word frequencies and for the snooker ranking look quite similar indeed.
Another clear observation is that the value of the power law exponent is lower for the snooker ranking (a=0.71) than for the word frequencies (a=0.92). In fact, when considering one-year prize money rankings over a range of different years, there is quite some variation in the resulting power law exponents. Interestingly, these variations appear to be strongly correlated with the total amount of prize money that was available in a given year (or season).
If there is a larger total amount of prize money available in a given year, then the resulting power law exponent for the prize money ranking for that year is smaller. A smaller power law exponent, in turn, means that the prize money ranking is less dominated by the top players. This result seems significant in the context of ongoing discussions about the prize money distribution in snooker, and was recently confirmed on a more complete data set.[6]
In conclusion, and perhaps not too surprising given that power laws had already been shown to occur in other sports, they also show up in snooker rankings. Additional and more detailed results can be found in the full mathematical analysis that was published in the scientific journal Stats.[5]
As a final note, in the year 1935, when Zipf first described his findings of an inverse relationship between word frequency and rank, there was only one professional snooker tournament held: the world championship. Just five players competed in the tournament, and there was no prize money (the players made some money from spectator ticket sales). Even if Zipf had been interested in snooker, he certainly would not have found his famous relationship in such scant data. However, almost 90 years later now, power laws are clearly abundant in snooker statistics!

References
[1] G. K. Zipf. The Psychobiology of Language. Houghton-Mifflin, 1935.
[2] M. E. J. Newman. Power laws, Pareto distributions and Zipf’s law. Contemporary Physics 46:323-351, 2005.
[3] W. Deng, W. Li, X. Cai, A. Bulou and Q. A. Wang. Universal scaling in sports ranking. New Journal of Physics 14:093038, 2012.
[4] J. A. Morales, J. Flores, C. Gershenson and C. Pineda. Statistical properties of rankings in sports and games. Advances in Complex Systems 24:2150007, 2021.
[5] W. Hordijk. Snooker statistics and Zipf’s law. Stats 5(4):985-992, 2022.
[6] W. Hordijk. An analysis of prize money distributions in snooker. Preprints 2023061532, 2023.